Forcing and Feedback
ACS Climate Science Toolkit | How Atmospheric Warming Works
Our analyses of single-layer and multilayer models for the warming effect of planetary atmospheres assumed a balance between incoming solar energy and outgoing thermal IR energy averaged over the whole planet. However, the figure below shows clearly that, over geological time, the Earth’s temperature and atmospheric composition have varied. During warm, interglacial periods denoted by the grey bars, the concentrations of greenhouse gases, CO2 and CH4, were higher than during the colder, glacial periods. These temperature variations must mean that the energy balance has been repeatedly disturbed and the planetary system responded by finding a new balance under a new set of conditions.

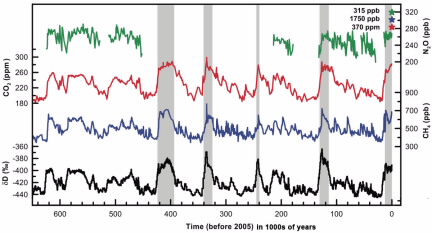
The most obvious variation in the figure is the recurrence of interglacial warm periods, denoted by the grey bars, at about 100,000-year intervals. This periodicity correlates with the variation in the eccentricity of the Earth’s orbit about the sun. The orbit is an almost circular ellipse but the amount of eccentricity (the ratio of the major to minor axis of the ellipse) varies from one maximum to the next about every 100,000 years. The interglacial periods occur when the eccentricity is at its maximum, that is, when, at some point during the orbit, the Earth is as close to the sun as it ever comes. The greatest effect of this close approach is not directly on the average amount of energy received, but on where it is concentrated due to the tilt of the Earth’s rotation axis.
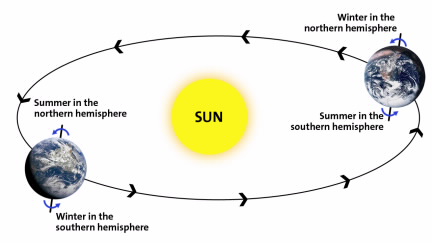
The tilt of the Earth’s rotation axis with respect to the plane of its orbit is responsible for the changing seasons. It is summer in the hemisphere that is tilted toward the sun and the radiation strikes the surface more directly. It is winter in the hemisphere that is tilted away from the sun and the radiation strikes the surface more obliquely. The angle of tilt, the obliquity, varies from about 22° to 25° with a period of about 41,000 years.
These data are from bubbles of atmospheric gases trapped in ice cores bored from the Antarctic ice sheet. The black curve is a proxy for the temperature at which the ice formed. The isotopic composition of the water (deuterium to hydrogen ratio, 2H/1H) that forms the ice, varies with local temperature—the higher the ratio of deuterium to hydrogen, the higher the temperature at which the ice formed. Temperatures vary from place to place on the globe, but, over long time periods, the trends at all locations are similar.
Like a large wobbly spinning top, the Earth’s rotation axis precesses about an imaginary axis that is perpendicular to the orbital plane with a precession period of about 20,000 years. If the above figure represents today’s direction of tilt, the direction of the rotation axis will be tilted in the opposite direction 10,000 years from now.
The end of a glacial period (ice age) and onset of an interglacial, coincides with the times when the northern hemisphere tilts toward sun at high obliquity, the orbital eccentricity is at a maximum, and the Earth is closest to the sun during the northern hemisphere summer. Under these conditions, which recur about every 100,000 years, the northern summers become warmer, so that there is net melting of the ice sheet that has covered a substantial area of the northern hemisphere. The glaciers begin to retreat and a large amount of freshwater flows to the ocean.
Feedback
The process described above is called orbital forcing, because changes in the Earth’s orbit (and precession axis tilt) forced a change in the northern hemisphere climate that produced a net change in the ice sheet. However, the total amount of energy reaching the Earth is changed only slightly by orbital variation—it is the distribution of the energy that brings about the milder climate. The redistribution is only temporary (on a geological time scale) and the climate change would be reversed, if there were no feedback effects in the planetary system.
One hundred centuries (10,000 years) from now, the precession of the Earth’s rotation axis will mean that winter in the northern hemisphere will begin in June and summer in December.

These diagrams are schematic representations of systems without feedback, and with positive and negative feedback. Without feedback (diagram A), an input into a converter produces an output of some magnitude. For example, orbital forcing energy input is converted to somewhat milder northern summers and produces net ice sheet melting.
For a system with positive feedback (diagram B), an input into the converter produces an output that changes some factor that provides a second positive input to the converter, with the net result that the output is increased. In our example, the ice sheet melting produced by the energy input from orbital forcing exposes bare ground that has a lower albedo than the ice that had covered it. Decreased albedo means more energy from the sun is absorbed, the Earth warms more, even more ice melts, and the albedo is further decreased. Now the climate system is on the way to more complete ice sheet retreat than orbital forcing alone could provide.
In these diagrams, the triangles represent interactions that convert a forcing input from an external source to an output effect in the climate system. This output effect within the climate system might cause a change in some other part of the system that adds a second input to the converter, which can either increase the output (positive feedback) or decrease it (negative feedback). The plus (+) and minus (–) signs represent the relative direction of the input or output with their number representing the relative size of the input or output.
At least two further positive feedback effects also come into play as the climate begins to warm. As the oceans warm, they release CO2 into the atmosphere, which increases the greenhouse effect and further increases the warming (see below). See the ACS Climate Science Toolkit Ocean Chemistry section for further discussion. Also, as the oceans warm and more plants invade the previously glaciated areas, evaporation and transpiration of water increase the water vapor in the now-warmer atmosphere. Water vapor is another greenhouse gas and further increases the warming. The greenhouse gases make major contributions to the overall warming that ends a glacial period.
Recent analyses of global temperature and CO2 records from the last deglaciation that began about 19,000 years ago support this broad-brush picture but indicate that energy transport between hemispheres via the ocean’s vast circulation systems lead to differences in the timing of warming and feedback events in the north and south.
However, higher amounts of water vapor in the atmosphere can lead to increased cloud formation. The fluffy white clouds in the sidebar photograph reflect sunlight back into space and are opaque because the water droplets that form the cloud scatter the incoming light, thus further decreasing the amount that reaches the surface. These effects of clouds are examples of negative feedbacks in the climate system. For a system with negative feedback (diagram C), an input into the converter produces an output that changes some factor that provides a second input to the converter that is negative, with the net result that the output is decreased. In this negative feedback cloud example, the amount of warming that produces more water vapor is reduced by the cooling effect of increased cloud albedo. See the Climate Sensitivity page for further consideration of the important climatic roles of clouds.
Finally, after many centuries for these forcings and feedbacks to come to a steady state, a new balance between incoming solar energy and outgoing thermal IR energy is attained at a temperature a few degrees higher than during the ice age. Human society has expanded and flourished for more than 100 centuries in the present mild climate and has had profound effects on the terrestrial landscape as we exploit its resources. Among these resources are the great stores of carbon in fossil fuels, whose combustion provided energy for the very recent technological transformation of the Industrial Revolution. In the past two centuries, this combustion has increased the amount of CO2 in the atmosphere by about the same amount as the 70-century increase that caused the warming at the end of the last ice age.
The forcings introduced above—orbital forcing, changes in albedo, and the effects of greenhouse gases—can all be characterized as imbalances between incoming solar radiation energy and outgoing thermal IR radiation from the planet, radiative forcings. How to quantify this imbalance for the greenhouse gases is the subject of the radiative forcing page of this ACS Climate Science Toolkit.

;void(0);)