Thermal Energy in the Ocean
ACS Climate Science Toolkit | Oceans, Ice, and Rocks
Long before the age of sophisticated instrumentation or satellite gps systems, explorers discovered one of the most important characteristics of the oceans, the great currents that traverse them and move enormous volumes of water from one part of the planet to another. One of the best known in America and Europe is the Gulf Stream, named by and explored with only thermometers by Benjamin Franklin. The current, shown in this map, moves north along the coast of North America and then east toward northern Europe. Its discovery is often credited to Ponce de Leon. The current is so strong that sailing ships trying to sail against it (from east to west) sometimes actually traveled backwards when the winds were weak. Trips westward from Europe to North America could take two weeks longer than the eastward journey, if the navigators sailed in (against) the current instead of outside it.
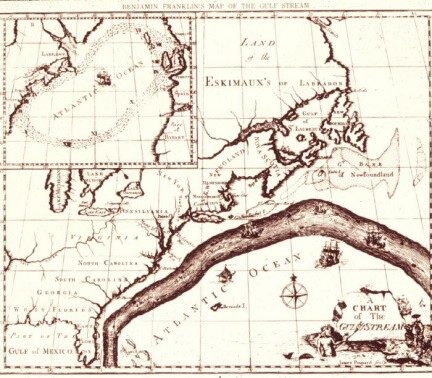
Due to his position with the American post office (in England) this latter observation was brought to Franklin’s attention in about 1769. He consulted a Nantucket merchant captain, Timothy Folger, who informed him about the current that was well known to colonial sailors. Franklin and Folger published this map, first in England and later in France, as an aid to sea traffic, including speedier mail delivery. Franklin followed up with experiments on his several trans-Atlantic voyages during which he measured the temperature of the ocean within and beside the current, finding that the temperature of the current was several degrees warmer than its boundary waters.

His findings led him to suggest an origin for the current, to give it the name “Gulph Stream,” and, always the practical scientist, to suggest that navigators add thermometers to their other instruments so as to take advantage of the current when eastbound and avoid it westbound. In essence, expansion of tropical waters by solar heating and the prevailing winds cause the western part of the ocean to be “heaped up” and steered clockwise around the north Atlantic basin by the Coriolis effect as the heap “falls” toward the lower water level to the north.
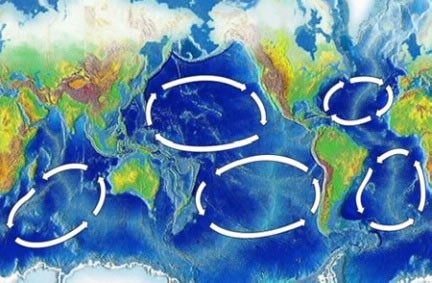
In addition to ships, the warm Gulf Stream conveys large amounts of thermal energy from the tropics to northern latitudes. The relatively mild winter climate of the British Isles and year-round ice-free harbors in Norway are among the consequences of this transfer of energy. The Gulf Stream and its complementary return current comprise one of the five major oceanic gyres, large systems of rotating ocean currents shown in the figure below. The gyres in the north and south Atlantic and Pacific and Indian oceans transfer energy rapidly, on a time scale of months, from low to high latitudes and tend to even out the temperature across the globe. Because they are wind-driven, the gyres are not very deep. Only about 100 meters or so of the ocean surface moves in the gyre, but this is a great deal of water. The water flow of the north Atlantic gyre, for example, is larger than the total flow of all the Earth’s rivers.
The Coriolis effect is a deflection in the path of a moving mass when it is viewed by an observer on a rotating frame of reference. An observer at the Earth’s equator viewing a mass of water moving north on the surface sees the mass deflecting to the right (east). A French scientist, Gaspard-Gustave Coriolis, published the mathematics describing the force responsible for the effect in 1835. Note that Franklin realized that the water going north in the Gulf Stream eventually has to return south. The circuit is shown in the inset at the upper left of his map. Franklin’s letter to a French colleague, in which his Gulf Stream observations are included, is worth reading.
The fast-moving gyres do not mix much water between ocean basins. But a deep, slow-moving ocean current does mix water from all the ocean basins. It takes 1000-2000 years to complete the circuit shown in the figure below. When warm, salty surface waters get far enough north or south toward the poles, winds cool the surface, evaporate the water, and initiate freezing. Since it is pure water that evaporates or freezes out, the cold liquid that remains is increased in salinity and density. The dense saline solution sinks into the less dense liquid below and flows along the bottom toward the warmer less dense ocean at the equator.
The driving force for this “ocean conveyor belt” is the increased density caused by cooling and increased salinity, so the circulation is sometimes labeled as “thermohaline”, combining “thermo” (heat effect) and “haline” (salt effect). In climate science literature, it is usually called the meridional overturning circulation, or simply MOC, because it exchanges (overturns) deep and surface waters from north to south (meridionally). All branches of the MOC are connected through the parts of the current that circle Antarctica.
On 11 March 2011, the most powerful recorded earthquake ever to hit Japan triggered a catastrophic tsunami that did extensive damage on the Japanese east coast and swept large amounts of debris into the ocean. Some of the debris entered the north Pacific gyre in the middle of this map and in early May 2012 began to show up on the coast of British Columbia. The northern half of the gyre appears to take about 12 months for the transit from west to east.
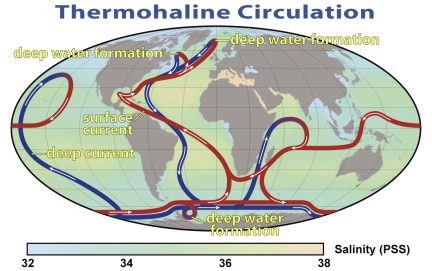
What goes down must come up. As cold, dense saline water sinks at high latitudes, it pushes deep water toward the surface at lower latitudes, as you can see toward the middle of the figure. This upwelling of the deep ocean water is essential to life in the oceans. From the ocean floor, these waters carry to the surface dissolved CO2 and minerals required by the microscopic,, photosynthetic phytoplankton that inhabit the top sunlit layer of the ocean. These organisms are the base of the food web that feeds essentially all marine life. About half of all photosynthesis on Earth is carried out by the phytoplankton, so their carbon-fixing and oxygen release contributions are significant. The nutrient-carrying capacity of the thermohaline-driven MOC is an important adjunct to its energy transfer properties.
All of the above phenomena have been part of Earth’s climate story for millennia. The other modules in this ACS Climate Science Toolkit focus on how outward radiative transfer of thermal IR radiation via greenhouse gases has maintained Earth’s energy balance at a temperature supporting abundant life on land and sea. Now, as a result of added atmospheric greenhouse gases, the energy balance has been upset. The planet is absorbing more energy than is leaving, so it is warming. The average temperature at the surface has warmed by about 0.6 K since 1950. The extra energy cannot have all remained at the surface or only warmed the atmosphere—the subsurface ocean must also have gained thermal energy.
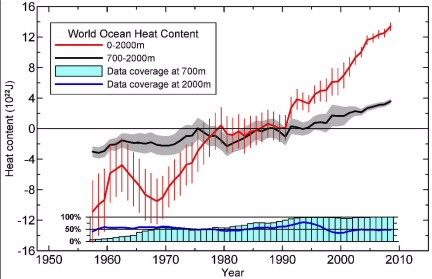
The data in this figure are derived from the temperature, salinity, and density of the ocean as a function of depth. The density and salinity are used to determine the heat capacity of the seawater at each depth, so that the temperature values can be converted to energy units. The instrumentation used to obtain these data is briefly described and pictured in the sidebar. The figure shows the energy content in the top 2000 meters of the ocean and the fraction that is found below 700 meters.
The figure shows that the ocean’s thermal energy gain over the 55-year period of measurements is about 24 × 1022 J in the 0-2000 m layer. About 30% of this, 7 × 10²² J, is in the lower 700-2000 m part, which indicates that a significant part of the energy gets mixed from the surface to moderately deep waters. Data for deeper abyssal waters are sparse, but suggest that they have gained only a few percent as much as the upper layers. As we have seen above, the deep water current is very slow, so not a large amount of the warmed upper layers has yet reached the bottom.
The warming of the upper layers of the ocean from 1955 to 2010 has been about 0.09 °C, averaged over the entire 0-2000 m layer, and about 0.18 °C, averaged over just the upper, warmer 0-700 m layer. As the oceans warm their volume expands. Since their area is constrained within the continental walls, expansion increases sea level. This thermosteric effect has averaged a little over 0.5 mm·yr–1 for the 1955-2010 period—about 3 cm during this time. In addition, melting of glaciers, snow cover, and land ice sheets has added to sea level rise for a total of about 10 cm during this period.
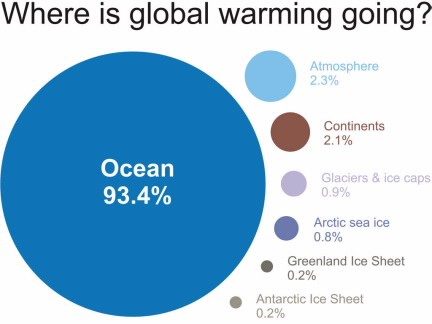
This graphic helps to put the warming ocean’s role in climate science in perspective.
A back-of-the-envelope calculation might add further perspective. Consider the ocean heat content for the 20 years from 1990 to 2010 when about 14 × 1022 J were added. Twenty years is about 6.3 × 10⁸ seconds, so this energy corresponds to an absorbed energy flux (watts) of
(14 × 1022 J)/( 6.3 × 10⁸ s) = 2.2 × 10¹⁴ W
This is only for the oceans and is a lower limit because the deep ocean is not included. Assuming that the measured energy is 90% of the total for the Earth, we estimate the flux for the whole planet as (2.2 × 10¹⁴ W)/0.9 ≈ 2.4 × 10¹⁴ W. The surface area of the Earth is about 5.1 × 10¹⁴ m2, so the absorbed flux per unit area is
(2.4 × 10¹⁴ W)/( 5.1 × 10¹⁴ m2) ≈ 0.5 W·m2
The 2007 IPCC estimate for net radiative forcing is about 1.5 W·m2. Our result suggests that about one-third of the Earth’s radiant energy imbalance is being captured and the great majority stored in the oceans. If radiative forcing were to be stabilized at its present level, that leaves the remaining ∼1 W·m2 to continue the warming until a new radiative balance is attained, which could be in a relatively distant future.
The salinity values represented on the map are given on the practical salinity scale (PSS) which is based on the ratio of the electrical conductivity of the seawater sample to a standard solution of KCl, both at 15 °C and one atmosphere pressure. A ratio of exactly 1 corresponds to 35 on the scale, which is almost exactly 35 ppt salts. The salinities are generally lower near the poles, where melting ice dilutes the saline seawater, and higher nearer the equator, where evaporation increases salinity.
The solid Earth also gains thermal energy, but a relatively small amount because the energy has to diffuse from the surface and there is no convective mixing, as in the atmosphere and oceans. Thermal energy also goes to melting ice on land and in the sea. See the last graphic on the page.
The three devices used to obtain data to monitor ocean energy content are pictured here. Conductivity-temperature-density (CTD) probes are complex units that are lowered by cable from oceanographic research vessels. They can descend, collect samples, and send back data from several thousand kilometers deep, but the available data are limited by the relatively small number of research vessels worldwide and the time and resources required.

Expendable bathythermographs (XBT) are used to get more extensive data because they can be launched from any ship. Looking a little like a rocket, an XBT drops nose down through the water at a known rate and returns its temperature and salinity data via fine copper wire (shown spooled inside in the photo). The time from launch is used as a proxy for the depth at which data are taken. At about 1000 meters deep, the wires run out and the XBT breaks free and sinks to the bottom.

Argo floats are autonomous devices that spend most of their time floating 1000 to 2000 meters below the surface. They are programmed to rise slowly to the surface every few days, taking salinity and temperature data as they rise, and then transmitting the data and their location via satellite before they re-submerge to start the process again. A consortium of nations deploys about 3000-4000 Argo floats. About 20% are replaced annually as they lose power or otherwise go out of service.

24 × 1022 J added over a half century is a lot of energy, but most of us have no feeling for how much it is. One way to give a sense of its size is to note that it is equivalent to the energy released by two Hiroshima-size atomic explosions, about 1.4 × 10¹⁴ J, added to the ocean every second for this entire 55-year period.
;void(0);)