Application to Earth’s Atmosphere
ACS Climate Science Toolkit | How Atmospheric Warming Works

The three-layer atmosphere model is repeated here to refer to as we apply the analysis of this model to what is observed for Earth’s actual atmosphere. For the IR-absorbing gases in the Earth’s atmosphere, we have to account for absorptions of different strengths and for condensable and non-condensable gases. For absorption strengths, there are, at one extreme, wavelengths where none of the atmospheric gases absorb IR radiation, that is, where all the emissivities in the diagram above are zero. In this case, the radiation leaving the atmosphere all comes from the surface and is characterized by its temperature, TP. For wavelengths where atmospheric gases absorb, but relatively weakly, emissivities in the higher, colder layers are zero and the radiation leaving the atmosphere comes from a layer of intermediate temperature. In the diagram, this might correspond to a wavelength for which ε3 is zero, so the radiation observed outside the atmosphere would be coming from the layer with the temperature T2.
For a condensable gas, most notably water vapor, there are very few molecules in the higher, colder layers of the atmosphere. Thus, emissivities at the wavelengths where water vapor absorbs are zero in the higher atmospheric layers. Radiation from water vapor comes from lower, warmer layers where the partial pressures and emissivities of water vapor are high enough to contribute.


Now we can use concepts derived from the multilayer model to interpret this emission spectrum of the Earth observed from outside the atmosphere. The dashed-line, black body emission curves are a temperature scale included to show the intensity of the emission that would be produced by black bodies of the designated temperatures. These temperatures, from top to bottom, correspond to the temperatures of the surface and atmospheric layers of increasing altitude and, hence, decreasing temperature.
Compare the shape of the emission centered at 15 μm (667 cm–1) to the absorbance spectrum of CO2 shown in the sidebar. The spectrum has a very strong absorption at 15 μm with weaker absorptions flanking it at higher and lower wavelengths. For the weakest absorptions, the corresponding emissivities are small and decrease quickly with altitude in the multilayer atmosphere. Thus, the emission observed at these wavelengths, around 16 and 14 μm comes from relatively warmer layers nearer the surface, with temperatures from about 280 to 260 K. The emissivities corresponding to the stronger absorptions near 15 μm are larger and the emissions from these wavelengths come from layers at about 220 to 210 K (about –60 °C), near the top of the troposphere.
The observed emission spectrum for wavelengths at the central absorption peak shows that this emission comes from layers that are warmer than the top of the troposphere. The emissivities corresponding to these wavelengths are so large that this radiation escapes into the stratosphere and is emitted only when the CO2 partial pressure has dropped low enough to no longer absorb these wavelengths. Since the stratosphere warms with altitude, the emission is from a warmer layer than the top of the troposphere. The same phenomenon is responsible for the similar feature observed at the center of the ozone absorption.
Although water vapor has strong absorptivities and corresponding strong emissivities for wavelengths at both ends of the thermal IR, its observed emission is only from the relatively warmer atmospheric layers nearer the surface. Higher layers are too cold to contain high enough partial pressures of water vapor to absorb the emissions from the lower, warmer layers. Thus, the emissions come from layers not too much below the freezing point of water. For more on the role of water vapor and its feedback connection with other IR-absorbing gases, see the Forcing and Feedback and Climate Sensitivity pages of this module of the ACS Climate Science Toolkit.

This is a low-resolution absorbance spectrum for the bending vibration of gaseous CO2 (mixture of 200 torr CO2 with 400 torr N2 in a 10 cm cell at ambient temperature). The absorption bands on either side of the central sharp peak are composed of a large number of absorptions between the rotational energy levels of one vibrational energy state to those of another. The individual vibration-rotation absorptions are too closely spaced to be resolved by the instrument used to measure the spectrum. Other features are due to “hot bands”, absorptions from molecules in a higher vibrational state due to thermal excitation at the sample temperature.
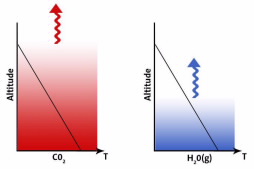
The graphic in the sidebar is a visual reminder of the preceding discussion.Each plot represents the troposphere with the concentrations of CO2 and H2O(g) shown as columns of color intensity decreasing with altitude. The black line plots the temperature as a function of altitude, the lapse rate. The squiggly arrows show the emission observed from each gas and the altitude from which it originates. In the atmosphere, these gases are mixed of course, but, for clarity, are shown separately in this graphic.
Finally, consider what the observed emission spectrum means for Earth’s energy balance. In order for the Earth’s temperature to remain constant, the outgoing energy radiated by the planet and its atmosphere must equal the incoming energy from the sun that is absorbed by the planet. To balance the present incoming energy, the planet must radiate to space an amount of energy equivalent to the emission from a black body at 255 K. Since the surface of the planet is, on the average, at about 288 K, it emits too much energy to maintain the energy balance. The observed emission spectrum shows that the IR-absorbing gases in the atmosphere reduce the temperatures at which emissions to space occur. This lowers the effective emission temperature of the planet and maintains its energy balance, so long as the atmospheric composition, surface features, and energy from the sun do not change. The effects of such changes are included in the Forcing & Feedback, Radiative Forcing, and Climate Sensitivity pages.
;void(0);)