References and Resources
Presentations
ACS Members can use these ACS Climate Science Toolkit PowerPoint presentations to share information about climate science with:
Other References & Resources
Energy Balance and Planetary Temperatures
Trenberth, K. E., Fasullo, J. T., and Kiehl, J. T., “Earth's Global Energy Budget,” Bull. Amer. Meteor. Soc., 2009, 90, 311-323. This article is the source of the energy balance diagram in the Atmospheres and Planetary Temperatures page and can be consulted to see how the values in the diagram are calculated.

How Atmospheric Warming Works
Pierrehumbert, R. T., “Infrared radiation and planetary temperature ,” Physics Today, 2011, 64, 33-38. This is an outstanding presentation of the infrared radiative transfer theory that is responsible for the greenhouse effect on Earth and other solar system bodies. This article is the source of much of the Multilayer Atmosphere Model page.

Lacis A. A., Schmidt, G. A., Rind, D., Ruedy, R. A., “Atmospheric CO2: Principal Knob Governing Earth’s Temperature,” Science, 2010, 330(6002), 356-359. Computer modeling is used to show that no condensing greenhouse gases are required to prevent “plunging the global climate into an icebound Earth state.”
Climate Science Challenge Grant Recipients
Find out more information on the Local Sections that are organizing activities related to the toolkit.

Four Surprising Facts about Climate Change infographic
Text version (PDF)
Knutti, R., Hegerl, G. C., “The equilibrium sensitivity of the Earth’s temperature to radiation changes ,” Nature Geoscience 2008, 1, 735–743. The authors say that in “the quest to determine climate sensitivity… fascinating new insights into the climate system and into policy aspects regarding mitigation have been gained.”
Archer, D., Global Warming: Understanding the Forecast, 2nd ed. (Wiley, New York, 2012), ISBN 978-0-470-94341 (pbk). This is a readable textbook based on a course for non-science majors at the University of Chicago. At http://forecast.uchicago.edu/index.html, the author describes the book as “a comprehensive introduction to all aspects of global warming. Written in an accessible way, and assuming no specialist prior knowledge, this book examines the processes that control climate change and climate stability, from the distant past to the distant future.” A small caveat is that some terms are used in a colloquial sense (for example, “heat” for thermal energy content—which we have also done in some of the Climate Science Narratives in this Toolkit). From this site, you can access an online, noncredit course, Open Climate Science 101, that offers the content of the author’s course via video lectures, tutorial exercises, and hands-on interactive models. One of these models was used to model the effect of doubling atmospheric CO2 on the atmospheric IR emission on the Radiative Forcing page.
Oceans, Ice, and Rocks
Levitus, S., Antonov, J. I., Boyer, T. P., Baranova, O. K., Garcia, H. E., Locarnini, R. A., Mishonov, A. V., Reagan, J. R., Seidov, D., Yarosh, E. S., Zweng, M. M., “World Ocean Heat Content and Thermosteric Sea Level change (0-2000 m), 1955-2010,” Geophys. Res. Lett., 2012, 39, L10603; doi:10.1029/2012GL051106. This is the source of the graphic on energy gain by the oceans in the Oceans, Ice, and Rocks section.

Hansen, J., Nazarenko, L., Ruedy, R., Sato, Mki., Willis, J., Del Genio, A., Koch, D., Lacis, A., Lo, K., Menon, S., Novakov, T., Perlwitz, Ju., Russell, G., Schmidt, G.A., and Tausnev, N., “Earth's energy imbalance: Confirmation and implications,” Science, 2005, 308, 1431-1435, doi:10.1126/science.1110252. The authors show how and where the Earth climate system is storing energy and the consequences. Download the article and supplements.
Zeebe, R. E., “History of Seawater Carbonate Chemistry, Atmospheric CO2, and Ocean Acidification,” Annu. Rev. Earth Planet. Sci., 2012, 40, 141–65. This review article is the source of the diagrams of the Earth’s rapidly exchanging and slowly exchanging carbon reservoirs in the Oceans, Ice, and Rocks section and provides a more complete look at seawater chemistry than in the Toolkit. The article is available at the author’s website.

Some effects of ocean acidification can be found in (1) Riebesell, U., “Climate change: Acid test for marine biodiversity,” Nature 2008, 454, 46-47. (2) Hall-Spencer, J. M., Rodolfo-Metalpa, Martin, R. S., Ransome, E., Fine, M., Turner, S. M., Rowley, S.J., Tedesco, D., Buia, M-C., “Volcanic carbon dioxide vents show ecosystem effects of ocean acidification,” Nature, 2008, 454, 96-99. (3) Kroekera, K. J., Michelia, F., Gambib, M. C., and Martzc, T.R., “Divergent ecosystem responses within a benthic marine community to ocean acidification,” PNAS, 2011, 108(35), 14515–14520.
Nicholls, R. J., Cazenave, A., “Sea-Level Rise and Its Impact on Coastal Zones,” Science, 2010, 328, 1517-1520. This is a review that is the source of the graphic on sea-level rise in the Oceans, Ice, and Rocks section.
Durack, P. J., Wijffels, S. E., Matear, R. J., “Ocean Salinities Reveal Strong Global Water Cycle Intensification During 1950-2000,” Science, 2012, 336, 455-458. A “News & Analysis” story in this same issue, Kerr, R. A., “The Greenhouse is Making the Water Poor Even Poorer,” Science, 2012, 336, 405, was later criticized, Roderick, M. L., Sun, F., Farquhar, G. D., “Water Cycle Varies over Land and Sea,” Science, 2012, 336, 1230, for equating the behavior of the water cycle over land and ocean. This brief exchange is a microcosm of the complexity of the climate system and climate analyses.
Climate Science Narratives
Somerville, R. C. J., Hassol, S. J., “Communicating the science of climate change,” Physics Today, 2011, 64(10), 48-53. A helpful article for scientists engaging with the public that includes a list of alternatives for terms that have quite different meanings for scientists and the public. Reading the comments included at the website provides a quick primer on the range of reactions one might get to a presentation on climate change.

12-17 (April 9, 2012) by Luca Tiberti
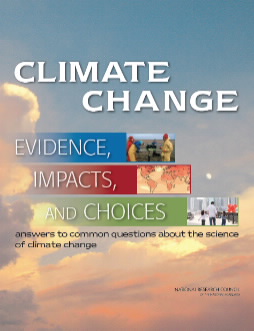
National Research Council (NRC) of the National Academies (in an agreement with NOAA) established a Committee on America’s Climate Choices that issued several reports. In addition, the NRC produced a booklet, Climate Change: Evidence, Impacts, and Choices that “(1) summarizes the current state of knowledge about climate change; (2) explains some impacts expected in this century and beyond; and (3) examines how science can help inform choices about managing and reducing the risks posed by climate change.” In addition, a video resource, Climate Change: Lines of Evidence, “explains how scientists have arrived at the state of knowledge about current climate change and its causes.”
RealClimate: Climate science from climate scientists. “RealClimate is a commentary site on climate science by working climate scientists for the interested public and journalists. We aim to provide a quick response to developing stories and provide the context sometimes missing in mainstream commentary. The discussion here is restricted to scientific topics and will not get involved in any political or economic implications of the science. All posts are signed by the author(s), except ‘group’ posts, which are collective efforts from the whole team. This is a moderated forum.” The level of explanation and complexity presented here is similar to this Toolkit and covers a much broader range of topics.
Skeptical Science: Getting skeptical about global warming skepticism. “The goal of Skeptical Science is to explain what peer reviewed science has to say about global warming. When you peruse the many arguments of global warming skeptics, a pattern emerges. Skeptic arguments tend to focus on narrow pieces of the puzzle while neglecting the broader picture… This website presents the broader picture by explaining the peer reviewed scientific literature.” This site is very helpful for a non-climate scientist who wants to stay current with the literature on global warming and climate change. As the description says, many of the posts take to task the published arguments of global warming skeptics and these rebuttals help to sharpen one’s climate science reasoning and logic. Sometimes the comments elicited by these posts also demonstrate the futility of getting into a “tis-taint” argument, if you are trying to engage someone or a group in a climate science conversation.
General
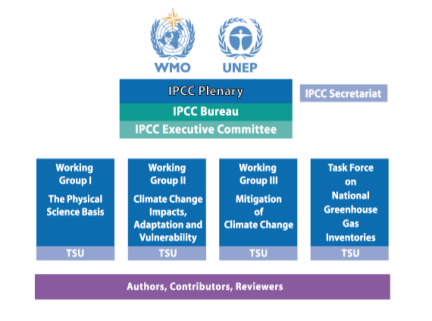
Intergovernmental Panel on Climate Change, “was jointly established in 1988, by the World Meteorological Organization (WMO) and the United Nations Environment Programme (UNEP), with the mandate to assess scientific information related to climate change, to evaluate the environmental and socio-economic consequences of climate change, and to formulate realistic response strategies. The IPCC multivolume assessments have since then played a major role in assisting governments to adopt and implement policies in response to climate change …” (IPCC, Climate Change 2007, Synthesis Report). The IPCC Assessment Reports have been published in 1990, 1995, 2001, and 2007, with the fifth Report due in 2013/2014. All the Reports and other IPCC publications are available via the website. Figures and data from the IPCC AR4 Working Group I, “The Physical Science Basis,” are used in the Toolkit.
NASA Goddard Institute for Space Studies (GISS), does research that “emphasizes a broad study of global change, which is an interdisciplinary initiative addressing natural and man-made changes in our environment that occur on various time scales — from one-time forcings such as volcanic explosions, to seasonal and annual effects such as El NiÑo, and on up to the millennia of ice ages — and that affect the habitability of our planet” (from the website Home page). NASA GISS is a rich source of data, images, and publications on climate science, climate modeling, and global change, including one of the on-going Earth temperature data sets.
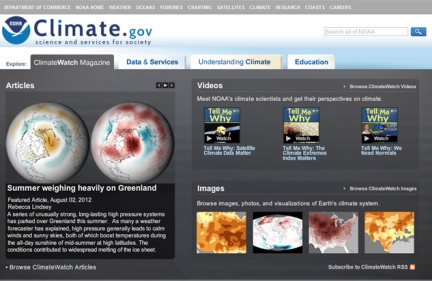
The NOAA Climate Portal has excellent resources to help scientists communicate climate change to the public. Visit the “Understanding Climate” and “Education” tabs. The NOAA National Climatic Data Center (NCDC) develops both national and global data sets that have been used by both government and the private sector to maximize the resources provided by our climate and minimize the risks of climate variability and weather extremes. See NCDC background on climate science and climate monitoring data, including global temperature change.
Climatic Research Unit (CRU), University of East Anglia, has developed a number of the data sets widely used in climate research, including the global temperature record used to monitor the state of the climate system [the HadCRUT jointly with the Met Office Hadley Centre (see the next entry)], as well as statistical software packages and climate models. Explore the site for publications and related materials on climate science and change.
Met Office Hadley Centre is the UK’s National Weather Service including a Climate Programme whose purpose “is to provide up-to-date, robust and traceable scientific evidence to government on climate variability and climate change.” The Centre produces and maintains a range of gridded datasets of meteorological variables for use in climate monitoring and modeling, including the monthly global land-sea temperature, HadCRUT, jointly with the Climatic Research Unit at the University of East Anglia.
Berkeley Earth Surface Temperature (BEST) study “aims to contribute to a clearer understanding of global warming based on a more extensive and rigorous analysis of available historical data. The study has reviewed data from over 39,000 temperature measurement stations across the globe.” The results presented to date, July 2012, provide a fourth record of global land-surface warming that complements and reinforces those from the groups cited above.
The National Snow and Ice Data Center (NSIDC) has data, resources, and photos that complement the previous data sources that are primarily focused on the atmosphere. For example, the NSIDC is the source for our graphics on Arctic sea ice and glacier retreat, as exemplified here for the repeat photos of the Muir Glacier, Alaska, in 1941 and 2004.

The International Research Institute for Climate and Society. Lamont-Doherty Earth Observatory of Columbia University, Climate Data Library “contains over 300 datasets from a variety of earth science disciplines and climate-related topics.” Among the many datasets are ones for clouds, precipitation, wind, and ocean that provide observations on these climate variables as they change over time and location.
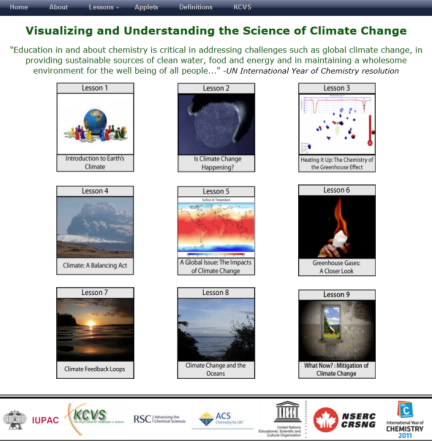
Visualizing and Understanding the Science of Climate Change, an International Year of Chemistry legacy project, is designed to help a global audience understand the science that underlies climate change, with a special emphasis on the role fundamental chemistry plays in processes affecting earth’s radiation balance. This is a set of nine peer-reviewed, interactive, multi-media resources developed under the umbrella of an International Union of Pure & Applied Chemistry (IUPAC) project by faculty and students at the King’s Centre for Visualization in Science (Canada), in collaboration with chemists and educators from the RSC (UK), ACS, UNESCO, and the Federation of African Societies of Chemistry.
12-17 (April 9, 2012) by Luca Tiberti
National Academies
;void(0);)