How Atmospheric Warming Works
Planets with atmospheres are warmer than they would be without their atmospheres. To understand how an atmosphere can have this effect, we begin by examining experimental data gathered by satellites orbiting outside the Earth’s atmosphere. Many weather satellites measure the energy being radiated into space from the surface and atmosphere. An example is shown in this figure.

Spectrophotometers and the use of absorption spectroscopy for sample analysis at many wavelengths, including the infrared, are familiar to most chemists. Thus, our first approach might be to interpret the figure as an infrared absorption spectrum with the surface of the Earth below the satellite as an infrared light source whose emission spectrum is that of a black body at about 320 K (117 °F—northern Africa at midday). Deviations from the 320 K curve, the dips where less radiation reaches the detector, would then be ascribed to absorption of infrared radiation by gases in the atmosphere. These are labeled to identify the infrared-absorbing gases: H2O at the ends of the wavelength range here, CO2 with absorption between 13 and 17 μm (about 800 to 600 cm–1), O3 between 9.5 and 10 μm (1050 to 1000 cm–1), and CH4 around 7.7 μm (about 1300 cm–1). These are greenhouse gases responsible for warming the Earth and creating the conditions for life, as we know it.
The Nimbus 4 satellite orbiting about 1000 km above the surface of the Earth obtained the data in this figure. The solid black line plot shows the radiation in the thermal infrared region of the electromagnetic spectrum reaching the satellite’s detector on the cloudless early afternoon of May 5, 1970, when the satellite was over the Niger valley in northern Africa. Many other weather satellites have obtained similar data over the past four decades. The dashed curves represent the emissions that would be expected for black bodies at the temperatures indicated. Their relevance is explored in more detail in the Applications to Earth’s Atmosphere page of this ACS Climate Science Toolkit module.
The O3 here is in the troposphere, the layer of the atmosphere closest to the surface where essentially all of Earth’s weather occurs. This O3 is produced by photochemical reactions of NOx, CO, and volatile organic compounds, including CH4. Stratospheric O3 that protects the surface from the sun’s harmful UV radiation is produced by photochemical reactions of O2 far above the troposphere.
This interpretation of the atmospheric emission data based on experience with short-path IR absorptions in laboratory spectrophotometers fails to account for the very long path that radiation from the surface must take to reach the top of the atmosphere. For example, even at its pre-industrial atmospheric concentration, CO2 absorbs essentially all the 667 cm–1 surface radiation near the Earth’s surface. That is, these photons (and others absorbed by CO2) emitted from the surface never reach the top of the atmosphere. In spectroscopic terms, the absorption is saturated. Where, then, do the photons at these frequencies that are detected at the top of the atmosphere come from?
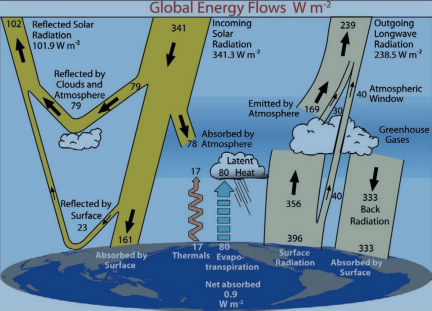
To understand the origin of this emission and how the atmospheric greenhouse effect works, we need to examine in more detail both the absorption and emission of thermal (infrared) radiation by the atmosphere. We will find that the satellite data shown above are temperature-dependent emissions from the surface and the atmosphere that sum to give outgoing emission that balances the incoming solar energy and in the process provides the warming mechanism. Accounting for all the energy transformations involved in the overall energy balance is complicated, but can be broken down into a few general categories. These are shown for the present energy balance (or imbalance with increased greenhouse gas concentrations) illustrated in this figure, which is discussed in more detail in Atmospheres and Planetary Temperatures.
The Earth’s blue sky is a different kind of long-path atmospheric phenomenon. In a short-path spectrophotometric experiment, visible light is not perceptibly scattered by atmospheric molecules. But in their long trek through the atmosphere, short-wavelength blue photons are scattered a bit more than long-wavelength red photons, so more blue photons reach the surface and we see the sky as blue.
In the following pages we will first introduce a single-layer model of the mechanism of the atmospheric warming effect and then a multilayer model that provides an interpretation of the observed data from the satellite. Essential to an understanding of atmospheric warming and climate are forcing and feedback effects, which are the most important components of climate sensitivity, the response of planetary temperature to a given amount of radiative forcing via greenhouse gas forcing.
We are vitally interested in the state of the atmosphere and its energy content, because we live in and share this ocean of air with a great many other living things. However, an important fraction of life on the planet lives in an ocean of water, which has a much larger role than the atmosphere in storing energy. The effects of the ocean on climate and the effects of increasing atmospheric CO2 and planetary energy gain on the ocean and ice are one of the subjects of the module, Oceans, Ice, and Rocks in this ACS Climate Science Toolkit.
The analysis in the Predicted Planetary Temperatures page of this ACS Climate Science Toolkit, shows that the infrared energy leaving the atmosphere has to be the equivalent of the energy emitted by a 255 K black body. The energy emitted over one small area, like that represented in the satellite data, is not necessarily equivalent to that of a 255 K black body—it may be more or less. The energy leaving the atmosphere summed over the entire planet must be the equivalent of that emitted by a 255 K black body.
;void(0);)