Ice and Climate
ACS Climate Science Toolkit | Oceans, Ice, and Rocks
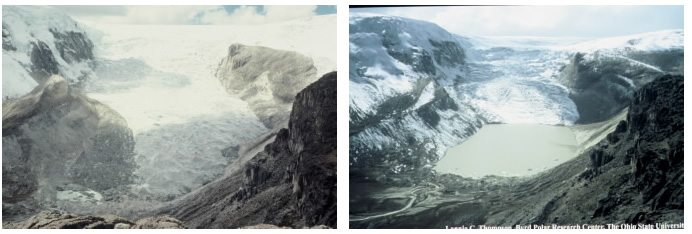
High in the Peruvian Andes, the Quelccaya ice cap and its associated glaciers, like Qori Kalis pictured here, supply water for a large population at lower altitudes. But the glaciers and ice cap are retreating as the Earth warms. A dozen years after the 1978 photo on the left was taken, the 80-meter deep lake in the middle of the 2004 photo on the right formed from melt water as the glacier receded. Carbon dating of well preserved, unfossilized plants exposed as the glacier melted indicates that they were buried in snow and ice about 5200 years ago. It appears that some relatively sudden climatic change occurred (perhaps a change in solar energy flux) that formed the glacier and we are now seeing its reverse as the Earth warms relatively rapidly.
Ötzi is the name given to the man whose preserved body was revealed by the melting of a Swiss glacier. Analysis showed that Ötzi died and then became entombed in ice and snow about 5200 years ago, another possible marker of a climatic change at this time that preserved plant and animal tissue.
Glaciers all over Earth are disappearing or losing volume or moving faster toward the sea. Arctic sea ice is disappearing as melting exceeds refreezing and the year-round, ice-free Northwest Passage may soon become more than the dream of explorers like Cabot, Hudson, Cartier, and Bering. These phenomena and others like them indicate that frozen water is decreasing in a warming world, as about 2% of the excess energy goes into the enthalpy of fusion of ice.
A little less than 2% of the water on Earth is ice. The great majority is in the polar regions, mainly on Greenland and Antarctica or floating in the sea, but it is all disappearing. The poster child for the decreasing Arctic sea ice is the polar bear, a lineage that apparently evolved from its brown bear ancestors about 150,000 years ago during a glacial age. Adapted to life in the Arctic, polar bears are often found on floating sea ice where they feast on seals that surface to breathe or others unwary enough to rest on the same floe. The figure below shows that multiyear ice, which provides summer hunting habitat for polar bears, is decreasing. With the ice goes the bears’ lifestyle, which is in danger as a consequence of a warming world.
The figure shows the five-year (2004 through 2008) trend in winter sea ice volume (black curve on the graph) in the Arctic. On the maps, Greenland and North America are at the bottom and left with northern Asia at the top. Multiyear ice (MY, red curve on the graph) is ice that has lasted from one winter to the next, whereas first year ice (FY, blue curve) is ice that has frozen for the first time in the year shown. Over these five years the amount of ice that has lasted for more than one season declined by about 60%. The first year ice freezes during the winter and melts the following summer.


A less obvious consequence of sea ice loss is the change in the Earth’s albedo. Ice and snow reflect a good deal of the solar radiation that falls on them. But liquid water is an excellent absorber of the sun’s radiant energy, so replacing ice with liquid water decreases albedo. This acts as a positive feedback on warming as more energy from the sun is absorbed, further increasing the Earth’s energy imbalance. Interestingly, sea ice around Antarctica is not decreasing, but has increased slightly in the past quarter century. Possible explanations include the effect of Antarctic circumpolar winds or less dense melt water under the ice blocking warmer, denser water from reaching the ice.
The stratification of less saline, less dense sea water on top of more saline, more dense sea water could also have important consequences in the Arctic where fresh water from both land and sea ice melting lowers the salinity of the ocean’s surface layers. This layer of less dense water could act somewhat like a dam preventing the MOC, the vast thermocline-driven deep ocean current, from flowing far enough north in the Atlantic to cool and sink. This could slow or even stop the flow and disrupt the transfer of energy and nutrients around the globe. There is some evidence in the paleoclimatic record that the outpouring of fresh water from the melting ice sheet that covered all northern North America during the last glacial period had this effect.
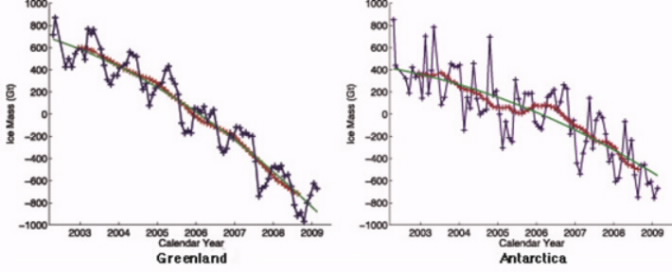
The ice melting from the Greenland and Antarctic land masses adds volume to the oceans and hence increases sea level. This is in addition to the thermosteric expansion caused by increasing ocean temperature. The amount of ice melted from these land masses has been measured since 2002 by the German-United States joint Gravity Recovery and Climate Experiment (GRACE) satellite program. These satellites detect changes in the gravity of the Earth beneath them and are sensitive to the changing mass of the Greenland and Antarctic ice sheets. The data in these figures show that from 2002 to 2009 the total ice loss from these two ice sheets was about 2500 Gt (≈ 2500 km3 liquid water).
Sea level rise over about the last century and a half is shown in the figure below. The data before 1993 are from tide gauges around the world and after 1993 are from satellite altimetry, which provides broader coverage of the planet. Although the factors that affect the sea level vary somewhat from one year or decade to another, the main factors are warming of the oceans and melting land ice. Other land and water use activities contribute small amounts.
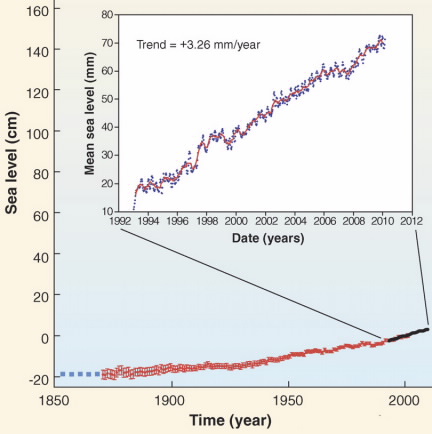
To provide some more perspective on Earth’s ice and ice melt, note that about 340 Gt of water (melted ice) raise sea level by about 1 mm. You can use this conversion factor to get an estimate of the sea level rise produced by future melting as the data become available. And there is a great deal of ice left that might or might not melt—the estimates of the amount of ice on Greenland and Antarctica are 2,850,000 km3 and 30,000,000 km3, respectively. If these ice sheets continue to melt at the same rate as today to the middle of the century, they would add about 4-5 cm to the sea level. However, one of the unknowns about the ice melt is whether it might accelerate as the Earth continues to warm. Even at an increased melt rate these vast ice sheets would continue making their contribution to sea level rise for many centuries.
;void(0);)