Greenhouse Gas Sources and Sinks
ACS Climate Science Toolkit | Greenhouse Gases
The sources of the gases given in these brief summaries are the most important ones, but there are other minor sources as well. The details of the sinks (reactions) that remove the gases from the atmosphere are not included. The graphic for each gas (or class of gas) is from Figure 1, FAQ 7.1, IPCC, Assessment Report Four (2007), Chapter 7. Human-caused sources are shown in orange and natural sources and sinks in teal. Units are in grams (g) or metric tons (tonne: international symbol t = 103 kg = 106 g). Multiples used in the figures are: Gt (gigatonne) = 109 t = 1015 g; Tg (teragram) = 1012 g = 106 t; and Gg (gigagram) = 109 g = 103 t.

Fossil fuel combustion and the global manufacture of cement are responsible for more than 75% of human-caused CO2 emissions. Deforestation, changing agricultural practices and other land use changes are responsible for the rest. Note that the units are given in terms of the mass of carbon emitted as CO2 to distinguish it from carbon in other forms, such as soot.
The combustion of fossil fuels produces CO2 with a different carbon-isotope signature than the CO2 present in the atmosphere before the Industrial Revolution. The CO2 from combustion has a lower 13CO2/12CO2 ratio. The 13CO2/12CO2 ratio of atmospheric CO2 has been dropping steadily as the concentration of CO2 has increased over the past half century. This change is strong evidence that human activity, the burning of fossil fuel, is the major cause of the increase in atmospheric CO2. Combustion requires and uses up oxygen from the atmosphere and precise measurements of the O2/N2 ratio in the atmosphere show that the fraction of oxygen is decreasing (measured in ppm relative to a standard sample).
The land-based sink is largely the incorporation of CO2 into the products of photosynthesis by green plants. The oceanic sink includes photosynthesis by phytoplankton as well as dissolution, acid-base reactions, and carbonate-forming reactions of many marine organisms. CO2 is also released from the ocean as pH and temperature change, so the figure shows the net effect as both sink and source.

Emissions of CH4 from human activities have exceeded natural emissions since the 1980s. CH4 concentrations grew an average of six times faster from 1960 to 1999 than over any previous 40-year period during the 2,000 years before 1800. The concentration in 2008 was 1797 ppb, about 2.5 times higher than during the preindustrial period.
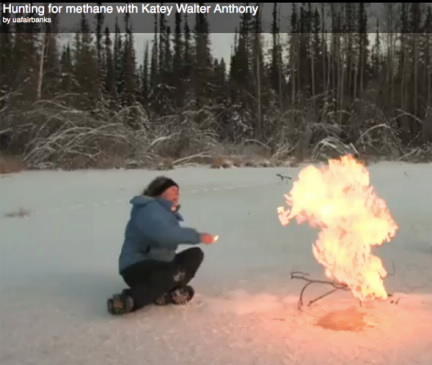
Human activities that produce CH4 include energy production from natural gas, coal and petroleum, decomposition in landfills, raising ruminant animals, and rice farming. Wetlands are the main natural source of CH4 (marsh gas produced by the anaerobic decay of vegetation). A similar induced effect is caused by the warming planet that has recently caused permafrost melting in the Arctic with accompanying decay of vegetation that had been frozen. CH4 now bubbles from shallow newly-formed lakes caused by permafrost subsidence and collects under the ice when these lakes freeze over in the winter. Poking a hole in the ice and igniting the resulting rush of gas produces a striking effect.
The main sink for atmospheric CH4 is oxidation by hydroxyl radicals, ·OH. The concentration of CH4 remained almost constant from about 1995 to 2006. The concentration of ·OH did not change appreciably during this period, so the rate of CH4 destruction was constant, which implied that the rate of emission was also not changing. The concentration of CH4 again began to increase at about 7 ppb yr–1, about half the rate as during the 1980s.

Atmospheric N2O contributions from human activities are now about the same as contributions from natural systems. However, N2O concentrations grew about two times faster from 1960 to 1999 than over any 40-year period of the two millennia before 1800 and have continued to grow at the same rate to a 2011 concentration of 324 ppb.
Natural sources of N2O include oxidation of ammonia in the atmosphere and from nitrogen in soils, particularly tropical soils. Human activities add to the soil source since nitrogenous fertilizers are used extensively in agriculture to feed an increasing planetary population. Smaller human activity sources include fossil fuel combustion, biomass burning, and decay of livestock manure.
The major sink for atmospheric N2O is destruction in the stratosphere where the majority undergoes photolysis to N2 + O. The remaining N2O reacts with O to produce NO, which can enter into a stratospheric ozone-depleting reaction cycle. Thus, N2O, like many halogen-containing gases, is important both as a greenhouse gas and as an ozone-depleting substance.

Almost all of the long-lived halogen-containing gases in the atmosphere are synthetic and did not exist in the atmosphere before the industrial era. Only a few such gases, for example, methyl bromide, methyl chloride, and tetrafluoromethane (CF4), occur naturally. The light orange bars here are the emissions in 1990 and the dark orange in 2002. The decrease in emissions of the chlorofluorocarbons (CFCs) is a result of the Montreal Protocol on Substances that Deplete the [stratospheric] Ozone Layer (1989 and subsequent revisions), an international agreement that has phased out the production and use of these gases, which are mainly used as refrigerants. The hydrochlorofluorocarbons (HCFCs) are in the process of being phased out by 2030. The Kyoto Protocol (2005) is aimed at phasing out or reducing the production and use of a number of greenhouse gases, including the hydrofluorocarbons (HFCs) and perfluorocarbons (PFCs), whose emissions are rising. The United States has not ratified this protocol.
The processes that remove perfluorocarbons like CF4 and C2F6 (emitted in aluminum production) and SF6 (an electrical insulator and used in the semiconductor industry) from the atmosphere are very slow, so these greenhouse gases will persist for many 1000s of years. The amounts in the atmosphere now and whatever is added in the future are permanent residents

Gases, such as CO and CH4, which are emitted by natural biological processes and human activities, can react in sunlight to form O3 in the troposphere. Automobile emissions, including hydrocarbons and nitrogen oxides, NOx, also react in sunlight to form O3 (and other pollutants). Tropospheric O3 only lasts for a few days or weeks in the atmosphere, so its distributions are variable. Levels of tropospheric O3 have increased about 38% since pre-industrial times, and this increase is due to atmospheric chemistry involving short-lived pollutants emitted from human sources.
The most important and most abundant atmospheric greenhouse gas is water vapor. Human sources have only a small direct influence on tropospheric water vapor concentrations, because they are largely controlled by local temperatures. The water vapor concentration can be several percent over warm tropical seas and very low over frigid ice fields at the poles. As planetary warming occurs, water vapor concentration increases and adds to the warming effect.

;void(0);)